Here’s a example Chart.js Line Chart. How to create a simple line chart with two data sets over the years and color it that it looks nicer. With lineTension you can stop interpolating the data, instead you have straight lines.
Inhaltsverzeichnis
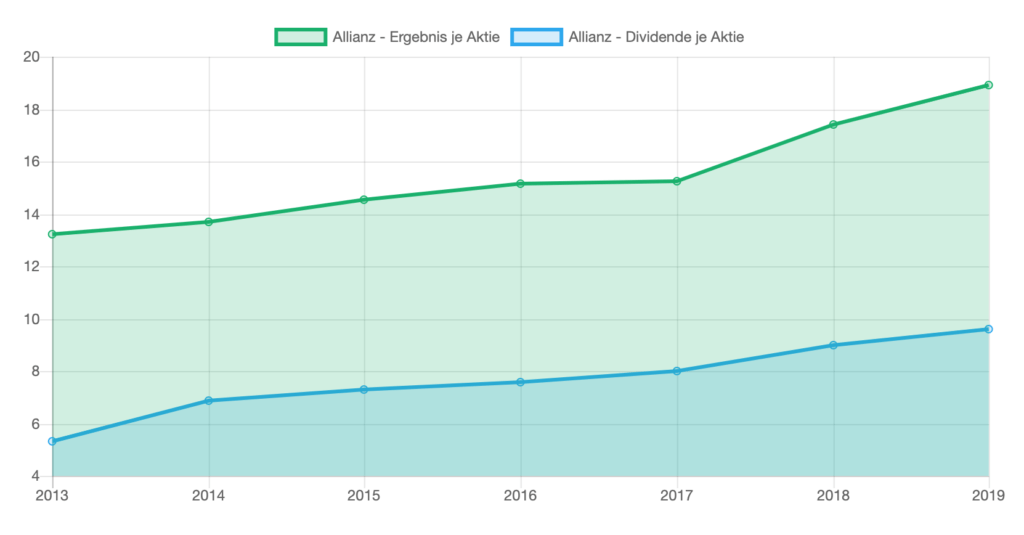
Demonstration
Code
<script src="https://cdnjs.cloudflare.com/ajax/libs/Chart.js/2.5.0/Chart.min.js"></script>

<div style="width: 800px; margin: auto; margin-top: 15em;">
<canvas id="line-chart"></canvas>
</div>

<script>
new Chart(document.getElementById("line-chart"), {
  type: 'line',
  data: {
    datasets: [{
      label: 'Allianz - Ergebnis je Aktie',
      lineTension: 0,
      data: [13.23, 13.71, 14.56, 15.14, 15.24, 17.43, 18.9],
      borderColor: 'rgba(0, 177, 106, 1)',
      backgroundColor: 'rgba(0, 177, 106, 0.2)',
    },{
      label: 'Allianz - Dividende je Aktie',
      lineTension: 0,
      data: [5.3, 6.85, 7.3, 7.6, 8, 9, 9.6],
      borderColor: 'rgba(34, 167, 240, 1)',
      backgroundColor: 'rgba(34, 167, 240, 0.2)',
    }],
    labels: ['2013', '2014', '2015', '2016', '2017', '2018', '2019']
  },
});
</script>