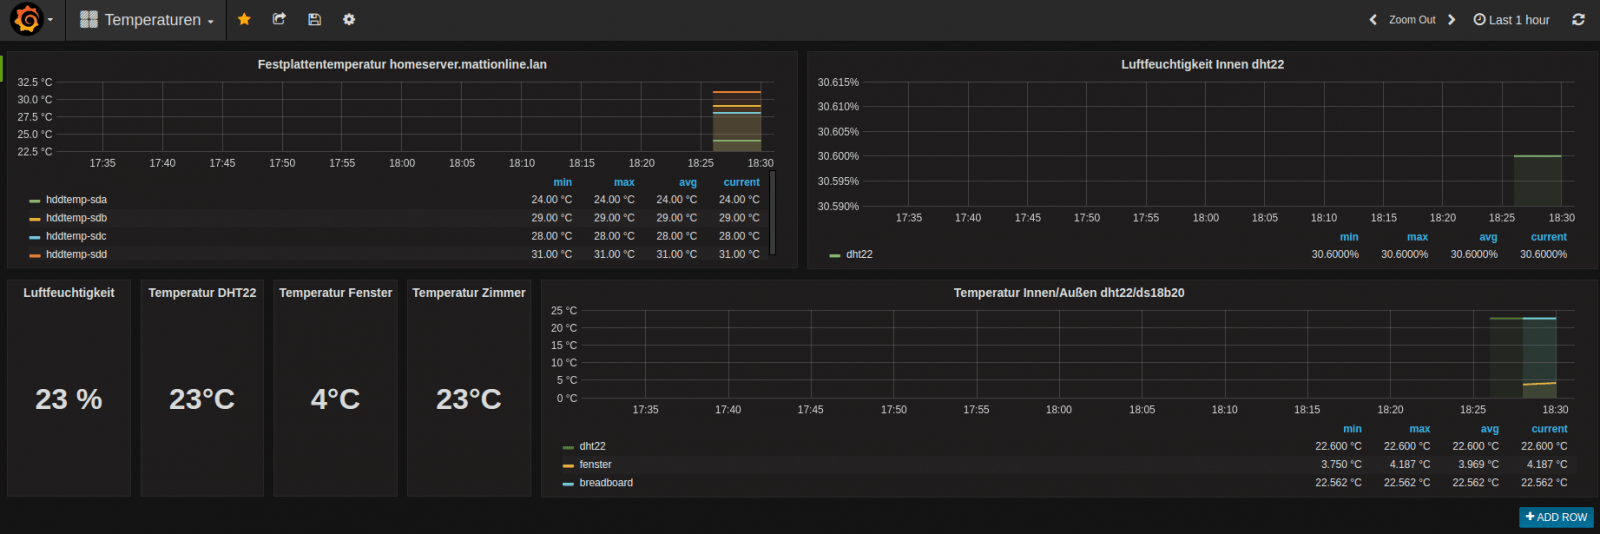
As you can see on the image, grafana has no more data received.
After a bit of debugging I found out that also the whisper files were correctly received (up to date).
#whisper file
root@monitoring:/var/lib/graphite/whisper/icinga2/pisensoren_mattionline_lan/services/ds18b20-28-0116106adaee/ds18b20/perfdata/temp# ls -la
insgesamt 196
drwxr-xr-x 2 _graphite _graphite 4096 Okt 20 22:21 .
drwxr-xr-x 3 _graphite _graphite 4096 Okt 20 22:21 ..
-rw-r--r-- 1 _graphite _graphite 191104 Nov 7 20:18 value.wsp

#carbon failed :(
systemctl status carbon-cache.service
● carbon-cache.service - Graphite Carbon Cache
 Loaded: loaded (/lib/systemd/system/carbon-cache.service; enabled)
 Active: failed (Result: timeout) since Mi 2016-11-09 18:13:50 CET; 2 days ago
 Process: 412 ExecStart=/usr/bin/carbon-cache --config=/etc/carbon/carbon.conf --pidfile=/var/run/carbon-cache.pid --logdir=/var/log/carbon/ start (code=killed, signal=TERM)

Warning: Journal has been rotated since unit was started. Log output is incomplete or unavailable.

#restart of carbon
systemctl restart carbon-cache.service
As you can see the whisper file was created but not updated since a few days.
The problem was a failed carbon process. After a restart it worked again.
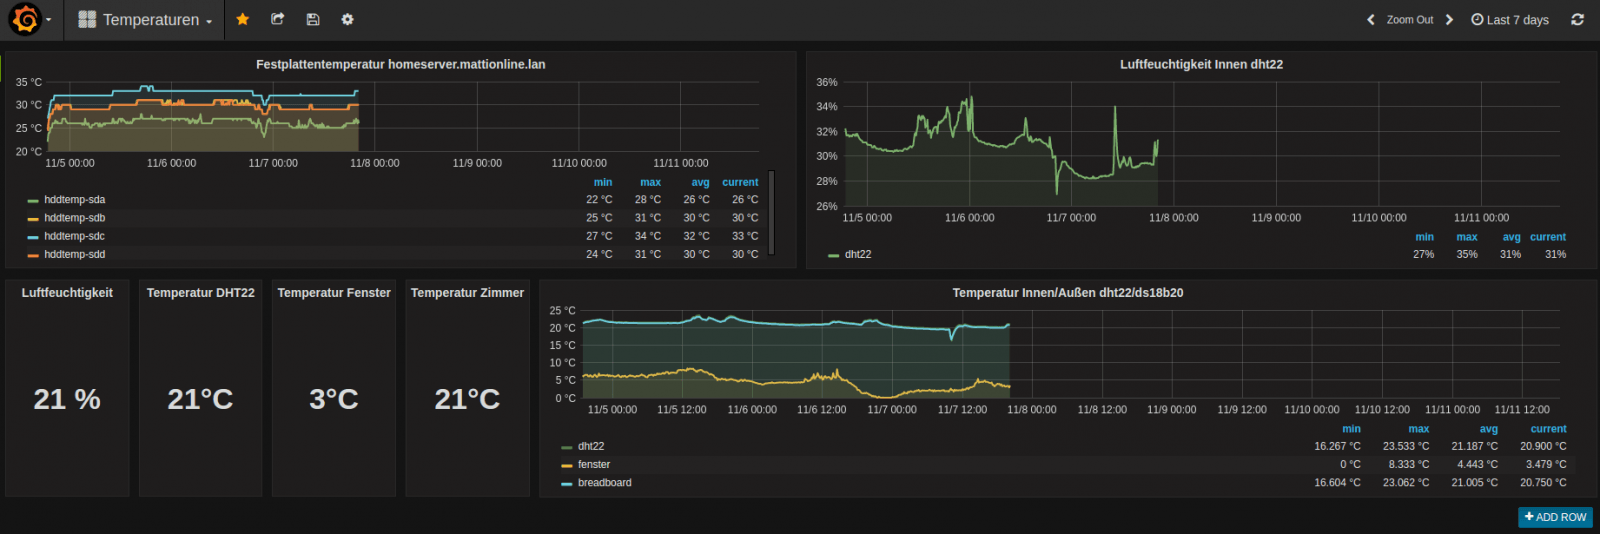
There is the data again 😀 Now i need a monitoring for carbon if it is running or not.